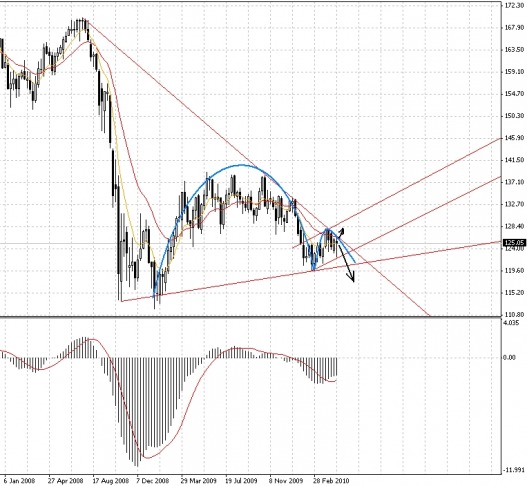
Previous week EurJpy was traded in range between 122.37 and 126.13. In the picture below, we see a weekly EurJpy chart. The downtrend trend-line is not broken. Also there lies inverted Cup and Handle pattern, which starts from January 2009 and is ending now. This type of formation can lead market in very bearish way.
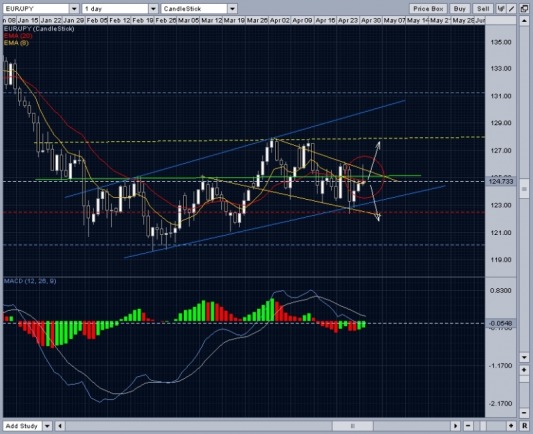
At the picture below, we see a magnified view of Handle. On Friday price touched descending trend - line (we see it at weekly chart) and pulled back to level 124.77. Friday's candlestick shows the unwillingness of price to break the resistance at 126.00. So the first days of the next week can be critical to decide where market can go. If price will pierce through 126.00 resistance, bulls can take more control. It means, that the formation of Handle can last longer, or even fail.
But continuation of bearish market on first days of the week can prove, that bears are in control again. Price breaking through Handle's lower line (Flag pattern - blue lines), through support at 122.37 and the main support at 120.00 can confirm Cup and Handle pattern in weekly chart. So maybe after several months we could see EurJpy at 100.00.
But continuation of bearish market on first days of the week can prove, that bears are in control again. Price breaking through Handle's lower line (Flag pattern - blue lines), through support at 122.37 and the main support at 120.00 can confirm Cup and Handle pattern in weekly chart. So maybe after several months we could see EurJpy at 100.00.
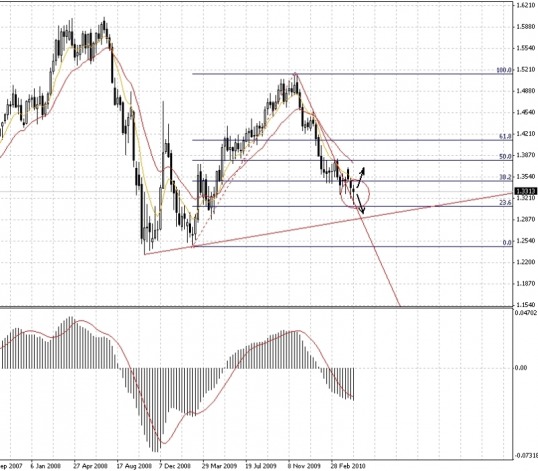
Like the EurJpy, EurUsd wasn't trendy. Trading range was between 1.3114 and 1.3416. In the picture below we see a weekly EurUsd chart. Price touched fibonacci retracement level at 23,6% and pulled back. Bulls are fighting bears. If next week will end with bullish candlestick it may form a Morning Star pattern. This formation and the breaking of downtrend trend - line could be a start of correction of downtrend. This correction can lead price rise towards 1.42. But the week-end with a bearish candlestick can lead market to the south.
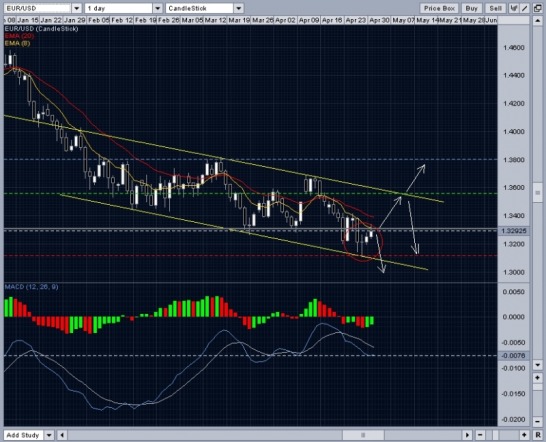
In the daily chart we see new low of EurUsd at 1.3114. Level 1.33 is a pivot point. First bearish days of the week can continue the bearish market. Price breaking through 1.3114 support can continue price falling to 1.287. But there is a divergence between price Lows and MACD. Bullish market in first days of the next week can be a clue, that the bulls are coming back and the week can end with a price at 1.36 or higher. Breaking 1.36 , 1.38 resistance levels can lead the correction towards 1.42.
The most important economic news to watch are: change in ISM Manufacturing and Non-Manufacturing PMI, Pending Home Sales, employment situation in US. The decision about solution of Greece, Portugal, Spain and Ireland economical problems is expected.
 RSS Feed