Hello, previous week was volatile in Forex market. In first half of the week it seemed that euro will continue to wane, but on the 1st of July everything changed.
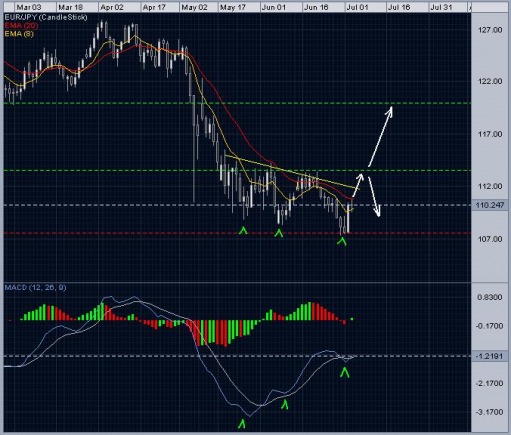
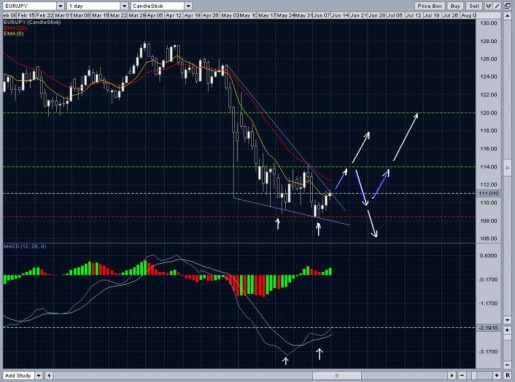
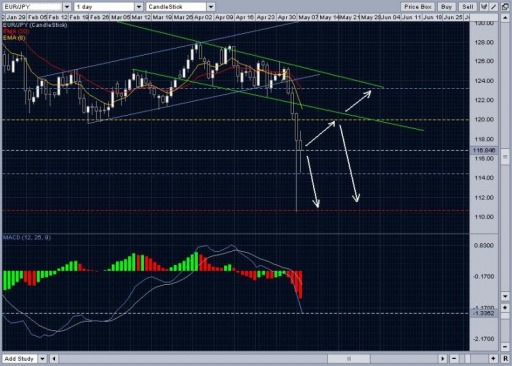
In the middle of the week euro - yen reached its new low at 107.32 and bounced, forming a morning star pattern. The most interesting thing is, that this is the third low in a row of Eur-Jpy price lows. These lows diverge with indicator MACD - price lows goes down, and indicator lows goes up. I checked them with green arrows. Sum of these events show us, that euro - yen is ready to take off and reach the 120.00 level. So for next week I expect price to reach 113.50 in first days. And if price breaks through this level, it may continue climbing up towards 120.00. But if it fails, we can see the 4th low :)
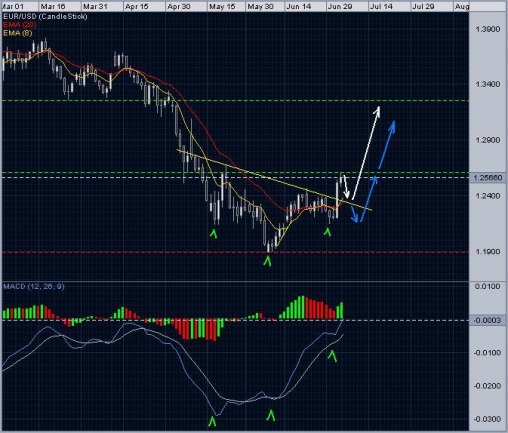
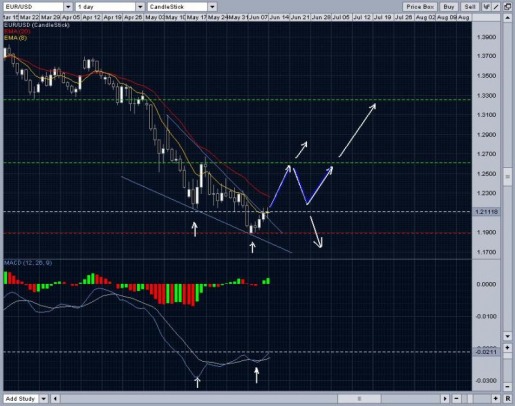
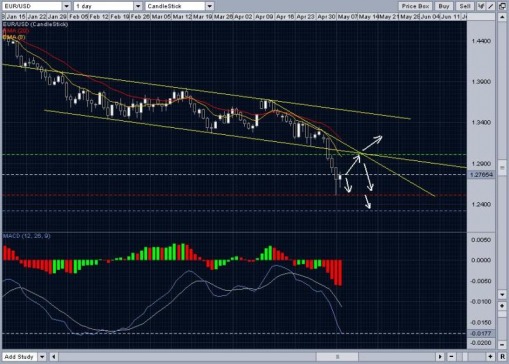
Like euro - yen, euro - dollar also suddenly changed its direction. Currently at daily chart we see a chart formation similar to Head and Shoulders pattern with yellow neckline, which diverges with MACD as it should be (I also checked divergence with green arrows). But here can lie the another Head and Shoulders pattern, which currently does not have second shoulder and its neckline coincide with dashed green line at price level 1.26. So for next week I see two options:
1. In first days price retraces to a yellow neckline and continues rising towards 1.325 (white arrows).
2. Price retraces deeper - till 1.215, then increasing to 1.26 and forming a second shoulder. When pattern formation ends, most likely price will climb up to a 1.325 level (blue arrows).
Main market drivers for next week will be: change or not in bank rates, employment changes.
Here's how I see market, thank you for reading and apllying my thoughs for yourself. :)
Hello, in Lithuania we have short work week, so my review will be short. So previous bullish week for EurJpy and EurUsd proved bullish harami candlestick pattern in EurJpy and piercing pattern in EurUsd. In a month or two I expect EurJpy to retrace to a price level 120.00 and EurUsd to a 1.34 level.
Next week for both currencies can be a little retrace and sideways play, or maybe a bullish trend.
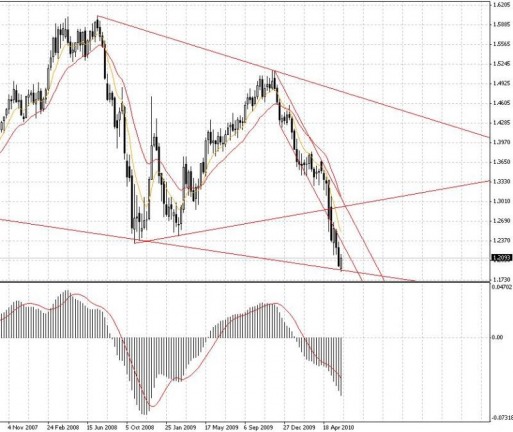
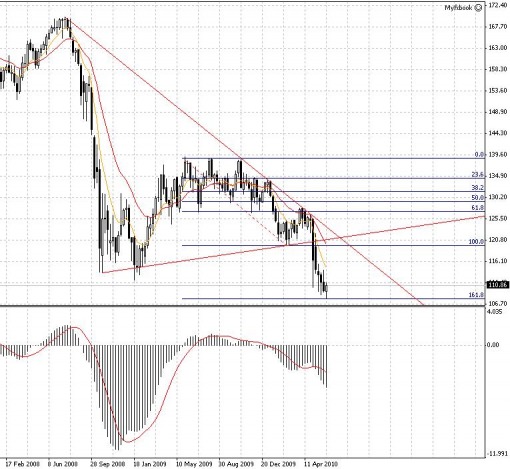
Hello. Previous week euro stopped falling against two other majors and showed some strenght. In weekly EurUsd chart we see, that the pair found its support at 1.1876. I think, this support is strong, because it is related with a forming "big flag" patterns lower support line (I mentioned it on my previous week report). Beside this, piercing pattern has formed. So if the next week will end with white candle, it may be a clue of returning bull market. As EurUsd, EurJpy pair also stopped falling. Price touched precisely a 108.06 level, range between cup support line and profit target is equal to a 2/3 of a cup deepness as theory states. So it may be no room for eurjpy to move south. Formed bullish harami pattern tells that euro strengthen against yen and bullish next week can be a sign, that euro will strengthen more. In daily EurUsd chart we see a wedge pattern formed and a double bottom pattern formed. Both bottoms diverge with MACD indicator. This says, that bear market maybe over. So for next week I expect EurUsd to reach 1.26. Price can pierce this level and continue towards 1.33. But more likely bulls will stop at 1.26, retrace to 1.215 level and form a reversed Head and Shoulders pattern. This may happen in one - three weeks. For EurJpy rules are same as for EurUsd: Price may reach 114.00 level, pierce it and move towards 120.00. Or fail a little bit at 114.00, find its support at 109.00, form reversed Head and Shoulders - bulls return. But failure of all this can cause a bears to continue its travel to south. So for next few weeks I expect both pairs to move in range market and maybe form some reversal patterns :). To more clearly determine market direction I will follow general economical news.
Hello, I'm back from holiday on FX and ready to face markets with a fresh - mind.
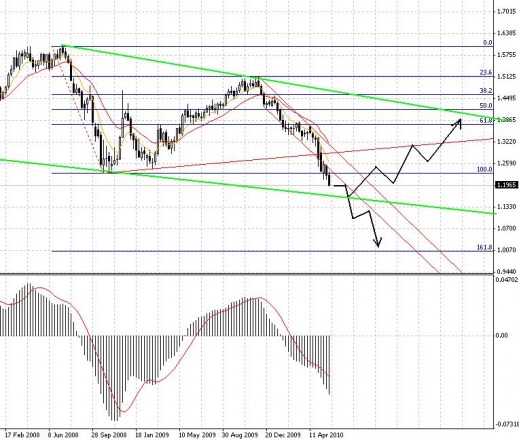
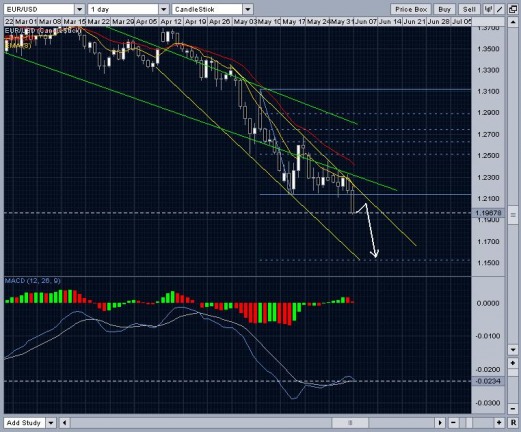
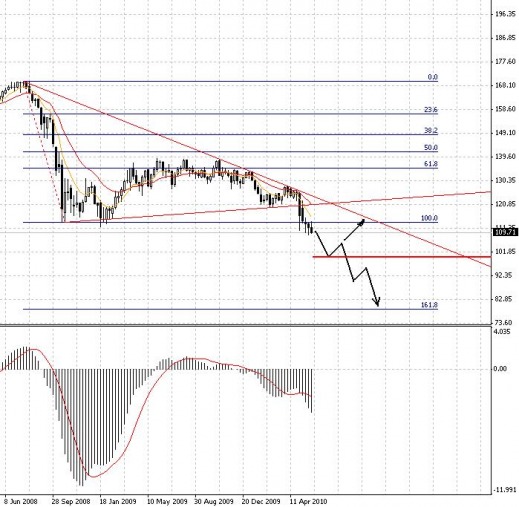
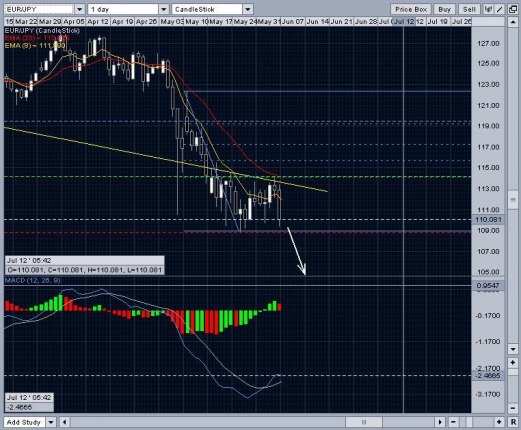
In these three weeks euro continued to fall against other majors - dollar and yen. In weekly chart we see, that EurUsd had broken its major support at 123.33 and week ended with 1.1965. For now I see two big scenarios: 1. EurUsd stop at level between 1.15 - 1.17 and the bulls return, forming a big flag (green lines). 2. EurUsd breaks through all supports it has and reaches level 1.00 (this may happen if problems of euro-zone countries will deepen). Let's take a look at daily chart. EurUsd started falling steeper than earlier (compare yellow channel with green channel). Also we see a formed descending triangle, which support at 1.21 on Friday was broken. I expect price to retrace to 1.21, to check its new resistance and then continue towards 1.15. Like EurUsd, EurJpy also broken its major support at 112.00. So, the next meaningful support can be at level 100.00 and failure of piercing it can fuel a bigger correction. Otherwise euro may fall against yen to a level near 80.00. Zooming into daily chart we see that support at 109.00 is holding on. If EurJpy will follow movements of EurUsd, this level will be not hard to break and the next stop can be 100.00 - 102.00 price levels. But a failure of this can cause a range market, which will move between 109.00 - 114.00. For now I don't see any possible reversals for both euro pairs.
Main news for euro and dollar will be on second half of the week. So I expect at that time market to be more volatile.
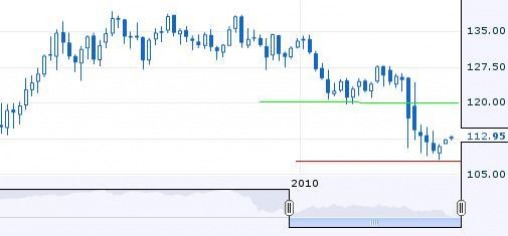
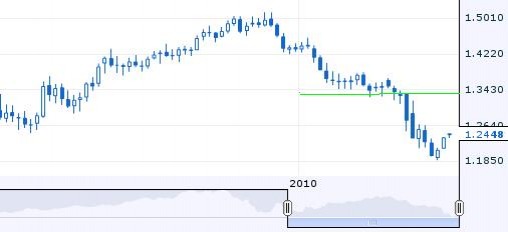
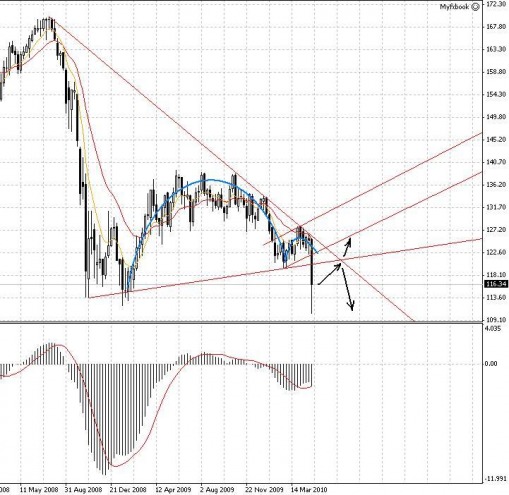
Last week for Euro was a big crash. Investors lost their confidence about Euro zone, when Greece problem was begun to solve. This caused the 1500 pips movement in EurJpy pair and 700 pips in EurUsd. In EurJpy weekly chart reversed Cup and Handle pattern did worked out. Support at 120.00 was broken.
The next week for EurJpy can be a continuation of bearish move towards 100.00 or can be traded in range between 110.00 and 120.00. Because of higher MACD level now than in second half of 2008, it may be a trend reversal sign, which may develop in month or two. But only good news in Euro zone and Japan’s export promotion can power up EurJpy to go up. But for now I would remain bearish or range.
In a daily chart we see formed two hammers with a long tails. Bullish Monday and/or Tuesday can be a sign of trend correction which can stop at 120.00 and continue to south. Breaking of this resistance can be a clue of possible reversal, but for reversals it takes time to develop. Breaking of 110.00 support can lead us to newer levels of underground.
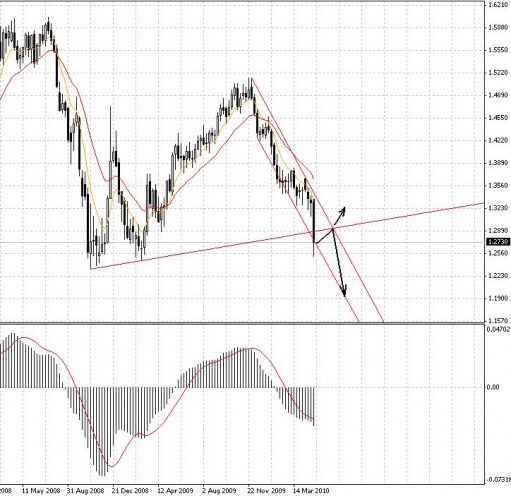
In weekly EurUsd chart we see, that the price has broken strong rising support at 1.29. Now I would rather expect correction than continuation of bear market. For now I don’t see any clues for a reversal.
Viewing the daily chart we see some hammers formed. As in EurJpy, first two days of the next week will show us the direction. Resistance at 1.30 is expected to be reached. Piercing it can couse a stronger correction, otherwise – continuation of bearish market towards supports at 1.20 – 1.23.
Next weeks news to follow: German GDP change, US trade balance change and retail sales on Friday. Also track, how economical situation in PIIGS countries is developing.
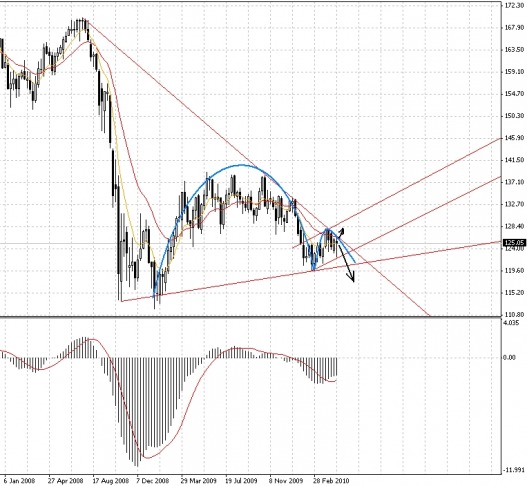
Previous week EurJpy was traded in range between 122.37 and 126.13. In the picture below, we see a weekly EurJpy chart. The downtrend trend-line is not broken. Also there lies inverted Cup and Handle pattern, which starts from January 2009 and is ending now. This type of formation can lead market in very bearish way.
At the picture below, we see a magnified view of Handle. On Friday price touched descending trend - line (we see it at weekly chart) and pulled back to level 124.77. Friday's candlestick shows the unwillingness of price to break the resistance at 126.00. So the first days of the next week can be critical to decide where market can go. If price will pierce through 126.00 resistance, bulls can take more control. It means, that the formation of Handle can last longer, or even fail.
But continuation of bearish market on first days of the week can prove, that bears are in control again. Price breaking through Handle's lower line (Flag pattern - blue lines), through support at 122.37 and the main support at 120.00 can confirm Cup and Handle pattern in weekly chart. So maybe after several months we could see EurJpy at 100.00.
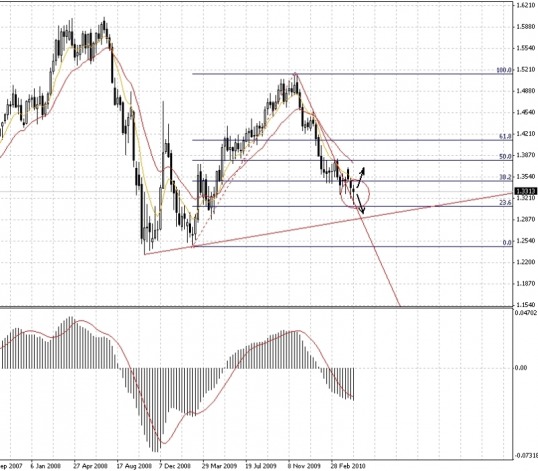
Like the EurJpy, EurUsd wasn't trendy. Trading range was between 1.3114 and 1.3416. In the picture below we see a weekly EurUsd chart. Price touched fibonacci retracement level at 23,6% and pulled back. Bulls are fighting bears. If next week will end with bullish candlestick it may form a Morning Star pattern. This formation and the breaking of downtrend trend - line could be a start of correction of downtrend. This correction can lead price rise towards 1.42. But the week-end with a bearish candlestick can lead market to the south.
In the daily chart we see new low of EurUsd at 1.3114. Level 1.33 is a pivot point. First bearish days of the week can continue the bearish market. Price breaking through 1.3114 support can continue price falling to 1.287. But there is a divergence between price Lows and MACD. Bullish market in first days of the next week can be a clue, that the bulls are coming back and the week can end with a price at 1.36 or higher. Breaking 1.36 , 1.38 resistance levels can lead the correction towards 1.42.
The most important economic news to watch are: change in ISM Manufacturing and Non-Manufacturing PMI, Pending Home Sales, employment situation in US. The decision about solution of Greece, Portugal, Spain and Ireland economical problems is expected.
Hello,
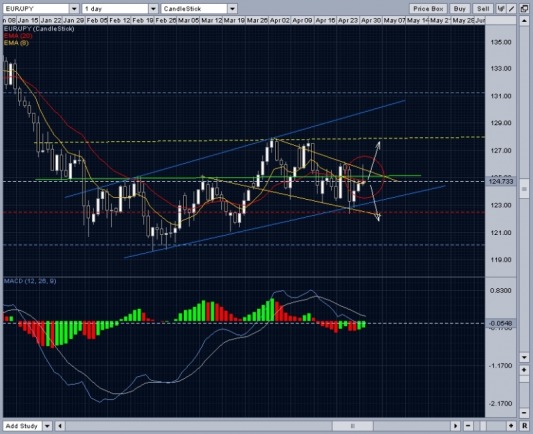
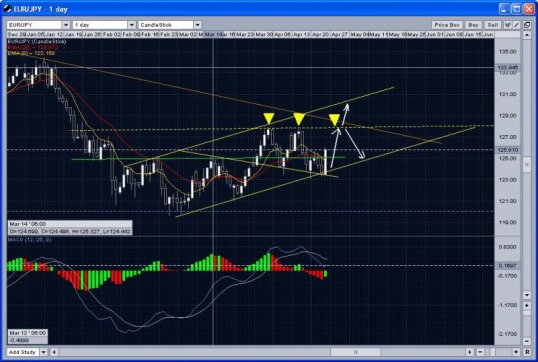
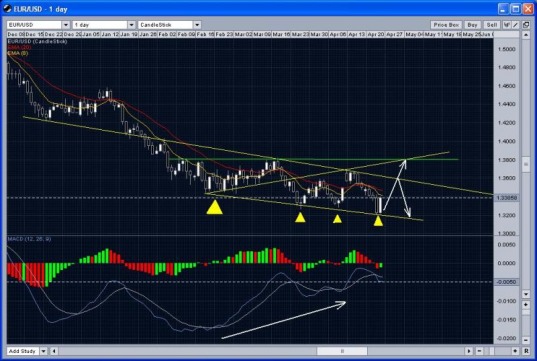
Previous week EurJpy did not manage go through 123.00-123.44 support. As we see in the picture, it touched the lower trend-line and bounced for 300 pips up on Friday. This means, that the bulls are serious about taking the market. Maybe Head and Shoulders didn't fail?... So I see some scenarios. Price reach 127.90 resistance level, break it and continues toward 130.00 price level. Or price reach 127.90 resistance, stop and turns back, forming triple top pattern, and if this pattern break the lower trendline, price continues falling to 120.00. But if it bounces from the rising support level at 125.00, then it will be a formation of ascending triangle, which may continue bullish market. This week in EurUsd pair was quite trendy. It found its new support at 1.3202 and like the EurJpy pair it bounced from support up for about 200 pips on Friday. In EurUsd we see formed triple bottom pattern. It is in divergence with price level, which was in the middle of February, when MACD indicator had lower meaning than today. So there is a big possibility, that the price will head towards 1.36 level, break it and go to 1.38 or even higher levels. Bulls can take control. But failing at 1.36 will continue the bearish market.
Last week price in EurJpy pair failed to break resistance level at 127.90. So I think that the Head and Shoulders pattern failed. It may be due to improving economic indicators in US and deteriorating economic situation in Euro-zone due Greece problems. For now if the price will not break through 123.44 support (red dashed line) it may continue going up towards 129.00-130.00 price level and forming a Flag pattern. Otherwise, breaking support at 123.44 will continue with a bearish market towards 120.00.
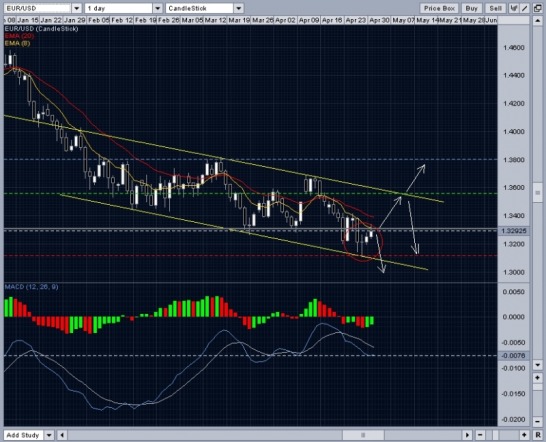
In EurUsd price did break through the descending trendline, but did not manage go to level 1.38. It may failed due same reason as EurJpy pair failed. For the next week, breaking through descending trendline may start a formation of descending triangle (if the support at 1.326-1.333 level will hold the bears), which indicates continuing bearish market. Otherwise it may find its new resistance at 1.36, and breaking this level may continue price movement towards 1.38.
Hello,
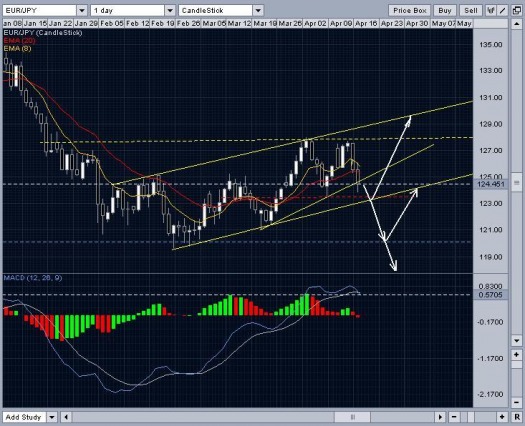
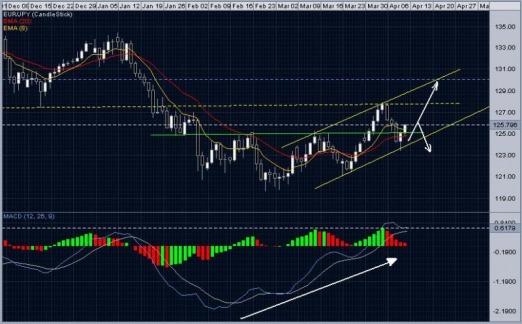
In the EurJpy pair we see a formed Head & Shoulders pattern, rising indicator MACD proves that. Price had a correction to check its new support level at ~124.00. It's almost at the patterns neckline. If the price breaks through 127.90 resistance it may go to 130.00. On the other hand there is a possibility that Head & Shoulders pattern will fail. And if price breaks down through ascending support level, we should look for new support at price level around 121.00.
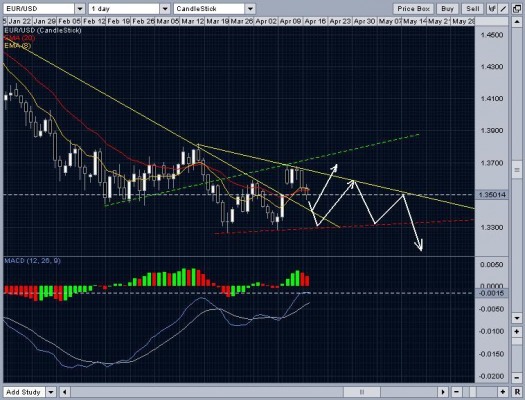
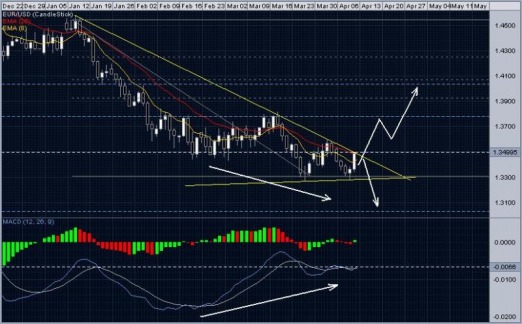
In EurUsd we see a forming double bottom pattern with bullish divergence with MACD. That means that if price breaks through the trend-line (it most likely will happen) the price may rise to 1.38 or even greater levels. But if all of this fails, we get a descending triangle and the bearish market will continue towards 1.30. Thank you for reading and remember - everything is just my opinion. :)
|
 RSS Feed