Hello,
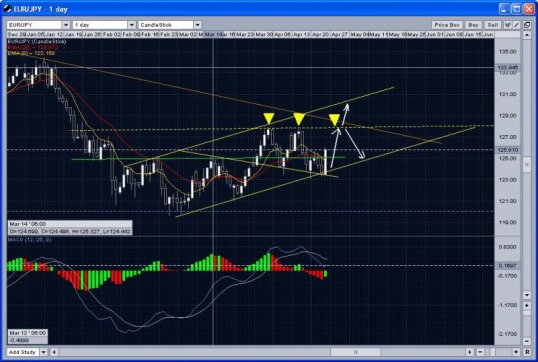
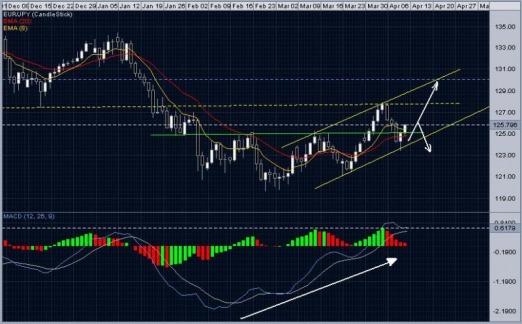
Previous week EurJpy did not manage go through 123.00-123.44 support. As we see in the picture, it touched the lower trend-line and bounced for 300 pips up on Friday. This means, that the bulls are serious about taking the market. Maybe Head and Shoulders didn't fail?... So I see some scenarios. Price reach 127.90 resistance level, break it and continues toward 130.00 price level. Or price reach 127.90 resistance, stop and turns back, forming triple top pattern, and if this pattern break the lower trendline, price continues falling to 120.00. But if it bounces from the rising support level at 125.00, then it will be a formation of ascending triangle, which may continue bullish market.
Previous week EurJpy did not manage go through 123.00-123.44 support. As we see in the picture, it touched the lower trend-line and bounced for 300 pips up on Friday. This means, that the bulls are serious about taking the market. Maybe Head and Shoulders didn't fail?... So I see some scenarios. Price reach 127.90 resistance level, break it and continues toward 130.00 price level. Or price reach 127.90 resistance, stop and turns back, forming triple top pattern, and if this pattern break the lower trendline, price continues falling to 120.00. But if it bounces from the rising support level at 125.00, then it will be a formation of ascending triangle, which may continue bullish market.
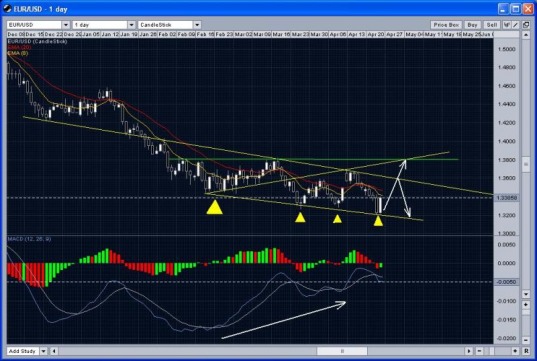
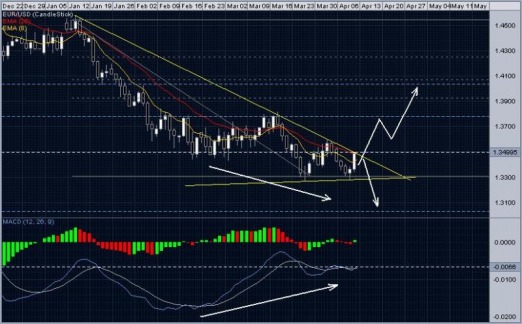
This week in EurUsd pair was quite trendy. It found its new support at 1.3202 and like the EurJpy pair it bounced from support up for about 200 pips on Friday. In EurUsd we see formed triple bottom pattern. It is in divergence with price level, which was in the middle of February, when MACD indicator had lower meaning than today. So there is a big possibility, that the price will head towards 1.36 level, break it and go to 1.38 or even higher levels. Bulls can take control. But failing at 1.36 will continue the bearish market.
 RSS Feed